Using & Editing Maps
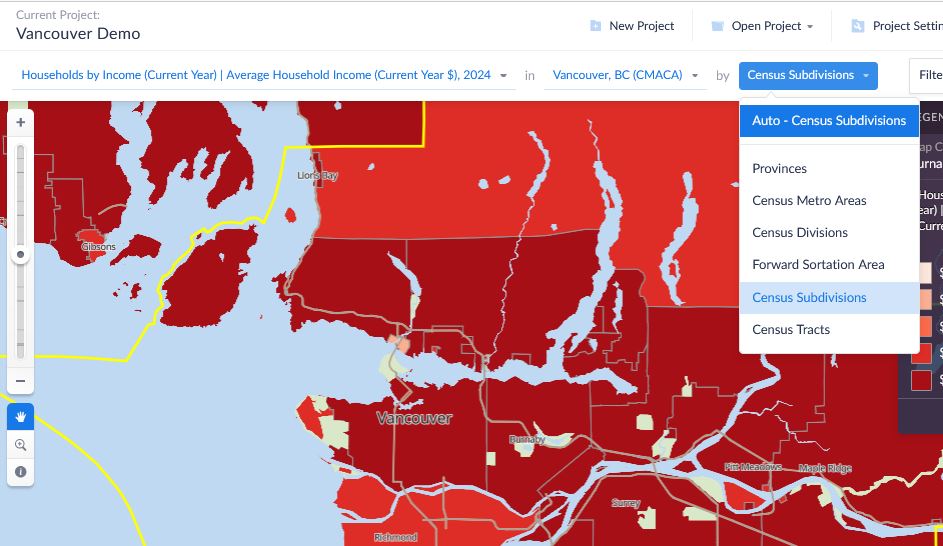
The default view of your project is a map. In the toolbar at the top of the map you will see that the map is displaying the total population in Vancouver CMACA (Census Metro Area Canada). The CMACA is represented by the yellow outline on the map. The second menu item above the map is by Census Subdivision. These are represented by the grey lines on the map

At the top of the screen, click on new project to give your project a new name. Hit enter to save the new name. Your project is set up and ready to go.

For our example, we are now going to use different functions to make the map show income by census subdivisions within Vancouver CMACA.
Navigating the Map
First we will navigate the map by using the map’s tools on the left side. There is a slider bar to zoom in or out of the map.

The icons below the slider bar are:
- The pan mode (hand) to click and drag the map to a different position.
- The zoom mode (magnifier) to draw a box around an area you want to zoom into.
- The info mode (letter “i”) to call up the data for a specific area. Click to activate the information window.

You can also add any location on a map to a project, add to your favourites list, or give the location a custom name using “Add alias location name” option. Close the information window when you are done.
Selecting the Variables
In the left sidebar there are three tabs: Locations, Data and Businesses. Select the Data tab. Under the tab are a list of variables or characteristics that you can include on the map. Select income.
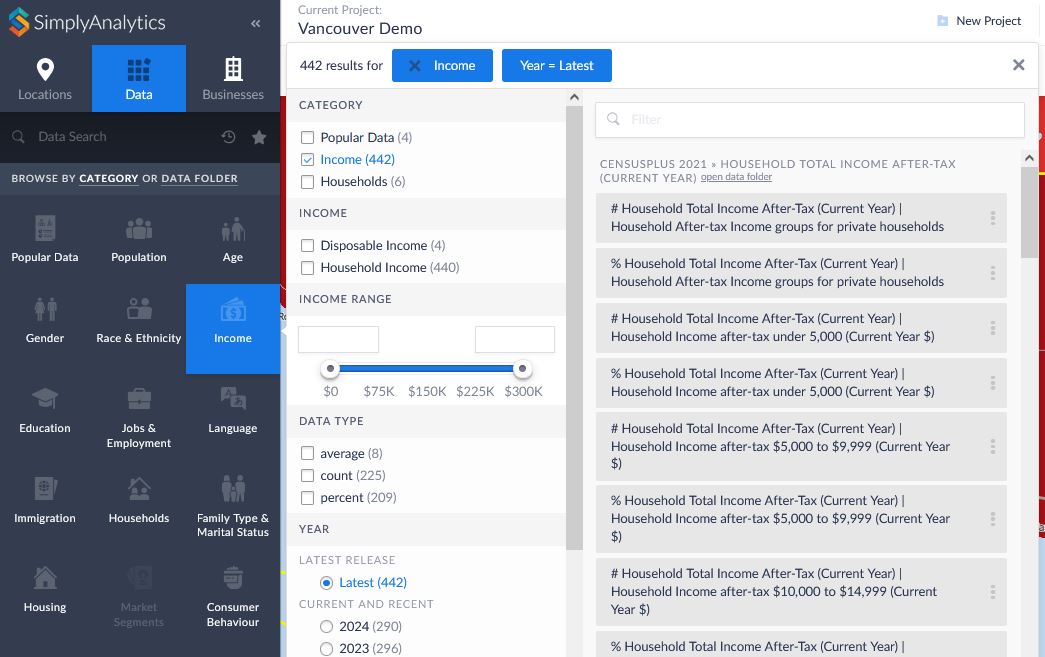
A variable selection panel opens. Use the filters in the first column of the panel to narrow down the options. For this example, under “Data Type”, select average. The selection appears at the top of the panel as a blue box. You can also remove any selections you’ve made at any time by closing a blue box.
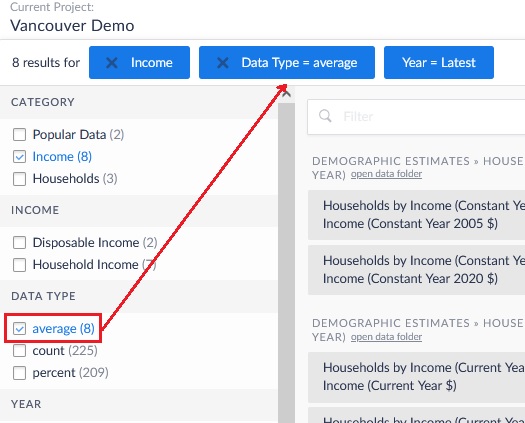
You can look at the details of variable listed in the second column of the panel. Let’s look at Households by Income (Current Year) | Average Household Income (Current Year $). Select its menu button (the vertical dots or ellipsis on its right) and choose View Metadata.
The “Variable Metadata” window opens. Here we see the following details:
- Year: 2024
- Path: Demographic Estimates » Households by Income (Current Year)
- Source Agency: Environics
- Vendor : Environics
- Dataset: Demographic Estimates
- Categories: Popular Data, Income
Here you can find out some additional details about this variable. We can see that it is an estimate variable for the year 2024. The data comes from an organization called Environics. Some data will be official census data and will have the Source Agency as Statistics Canada. Close the Metadata panel when you are done.
Managing the Variables
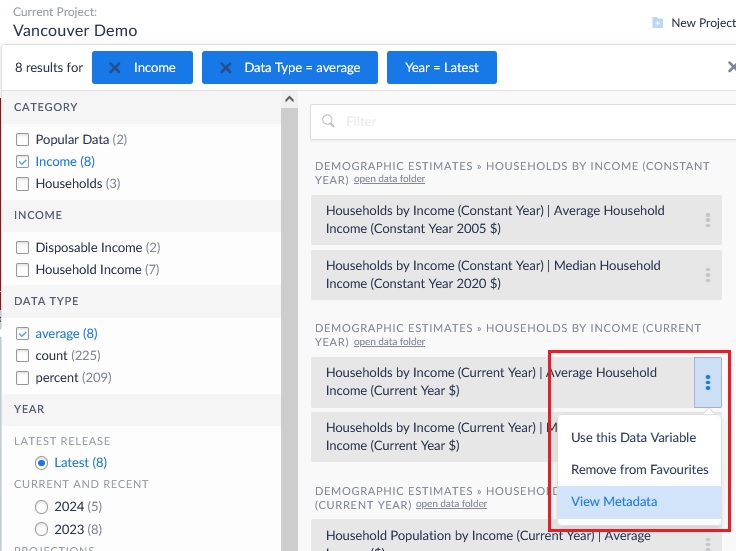
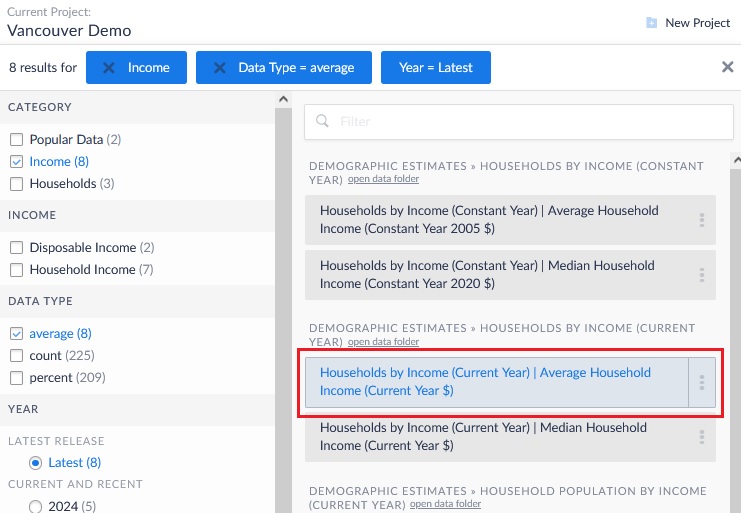
Now select the menu button again and choose Use this Data Variable. Any number of variables can be added at once, so that you can toggle which one is shown on the map. The variables you select will have a check mark beside them. For now we will stay with the average income variable.
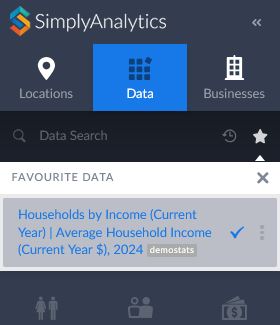
You can also add a variable to your Favourites so that you can find it again easily in the future. Select the menu icon (vertical dots) and then choose Add to Favourites. To view your Favourites, go to the main left sidebar and click on the star icon.
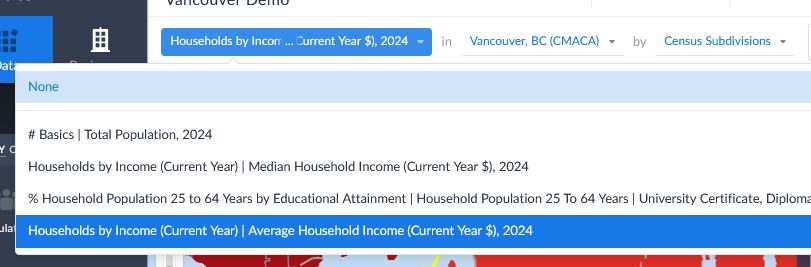
Notice that the map now displays the household income variable. Select the drop-down menu for the income variable at the top to display all the variables that have been added to the map. In our example there are the three default variables Simply Analytics always adds, plus the household income variable we just added. Leave the income variable selected.
Currently, the map is showing Vancouver CMACA broken down by Census Divisions. To show the Census Subdivisions instead, select the drop-down menu for Census Divisions, and change the selection to Census Subdivisions. Now the grey boundaries on the map show smaller regions that correspond to municipalities.
You are able to change the location by selecting the Locations tab in the left sidebar. For example, search for Nanaimo and select Nanaimo CMACA. The map now shows Nanaimo, but you can toggle back and forth between Nanaimo and Vancouver in the drop-down menu above the map.

There is no need to save the maps you create as they are saved automatically. They are listed in the right sidebar as “views”. Since you can have more than one map in a project, you can give each map a more descriptive name. Click on the tiny arrow in the top left corner of the Map tab and select rename. Hit enter when done to save the name.

You can duplicate a map for a different location, or create another map by selecting "New View" in the right sidebar, then selecting Map.

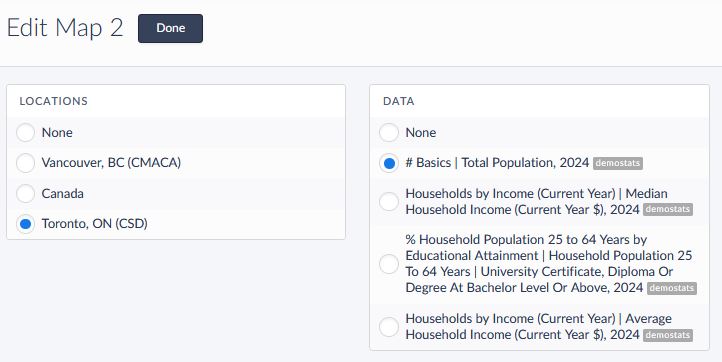
Select a location and data variable(s) to generate the new map. Below we've selected Toronto as the new location, and left the data variable at Total Population, 2024.
A new map of Toronto with the chosen variable(s) is generated. Now you can rename the map.

Modifying Colours & the Legend
You may wish to change the colours on your maps. To do this, select Edit at the bottom of the legend.

In the legend's edit panel, you can change the classification method, the number of categories (the example has 5 categories), the colour scheme, and the outline thickness and colour. When you select a colour box in Category Ranges, a window appears to allow you to change colours individually.

You can also decide which information to display on the map by selecting the 3 vertical lines (aka the hamburger) in the top right corner of the legend.

When you are satisfied with the legend and colours, select done at the bottom of the legend panel.
Adding Businesses to the Map
You can also add business locations to your maps. Select the Business tab in the left sidebar. You can type in a business name like Canadian Tire, browse business categories, or search by SIC (Standard Industrial Classification) or NAICS (North American Industry Classification System) codes.

In our example, we choose Information, then Motion Picture and Video Industries, and finally Motion Picture and Video Production. Our map now shows all the businesses in that category.

The numbers in the circles means there is more than one business in that area. As you zoom in on the map, those circles begin to separate into individual points.

When you select one of the circles, a panel opens listing all of the business in that area.
Exporting the Map
Once you are done with your map, you can export it. You may want to show the legend or not. Or you may want to show the labels and borders. To do this, select View Actions in the top right corner of the screen.

You also have the option to Apply Location Mask. This will “white out” the areas around the location you have chosen for your map.
Choose Export Shapefiles to email the map to yourself. The email will have a link to download the map.